
Spike Retail perspective
Know your business before your second coffee.
Spike Retail brings sales performance, shelf productivity, forecasting, and your sales pipeline into view.

Sample performance overview Last 12 weeks
Sales velocity+18.4%↑ 4.8% vs prior period
In-stock rate97.8%↑ 1.6 pts this week
Revenue$842K↑ 12.1% vs last year
Revenue & availability ● Revenue ● In stock
Explore Spike
Your business, from four angles.
Pick a view to see what’s inside. The demos use fictional data.
Interactive demo
Sales performance
See sales, velocity, inventory, and distribution in one view. Change the time period or drill into an item.
Open sales demo →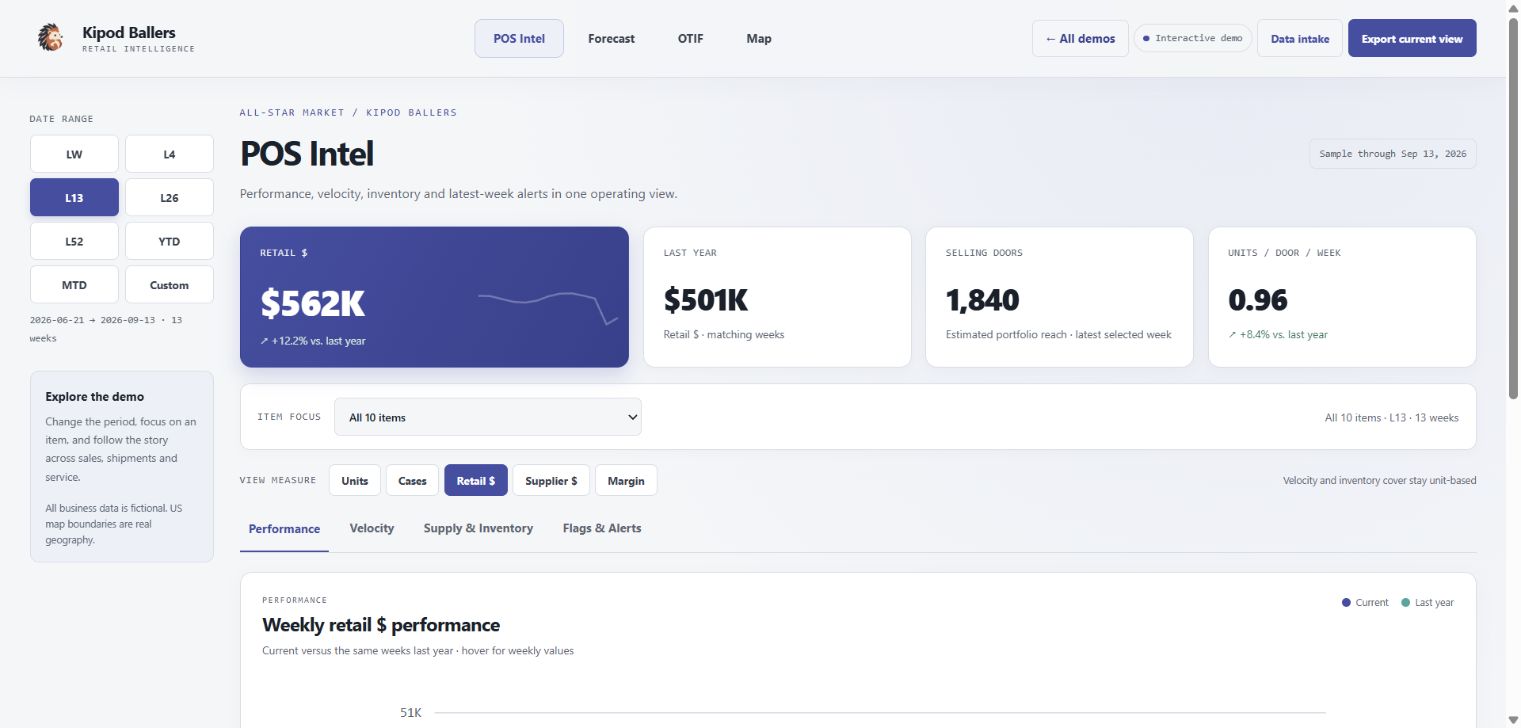
Actual demo screen · fictional data
Interactive demo
Shelf on a Page
See item performance alongside shelf space, category share, and the numbers behind each takeaway.
Open shelf demo →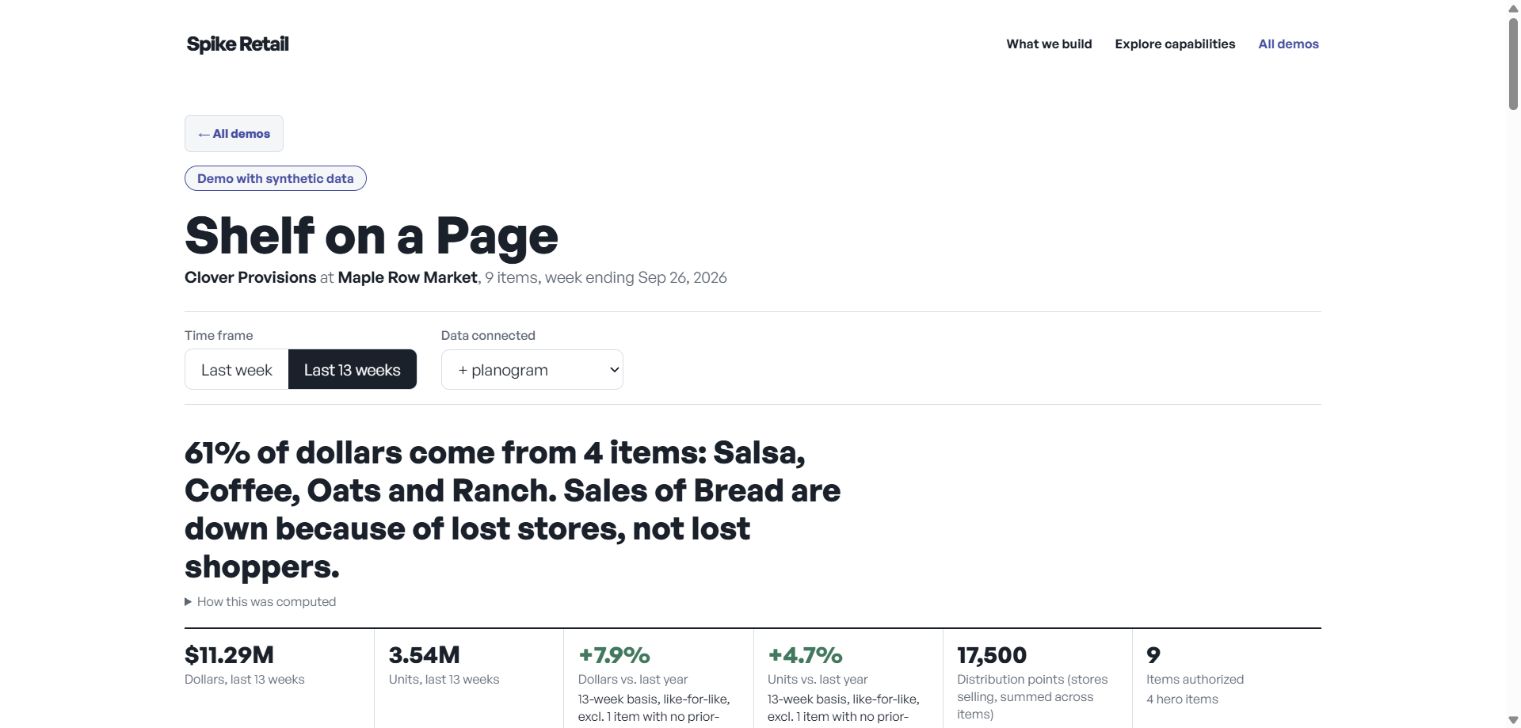
Actual demo screen · fictional data
Interactive demo
Forecasting
Compare planned shipments with the customer forecast, review consumption, and see shortfalls by date.
Open forecast demo →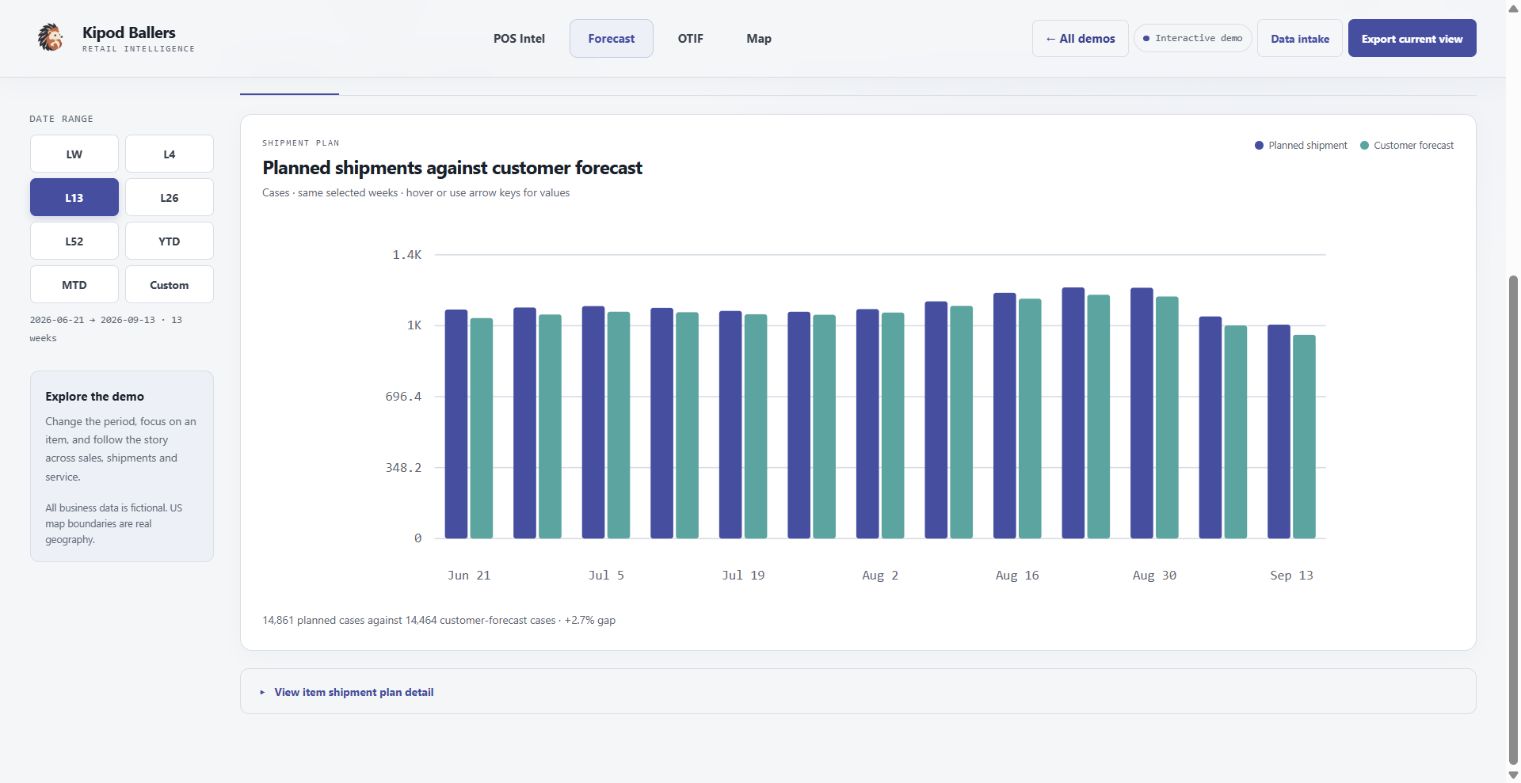
Actual demo screen · fictional data
Coming soon
Pipeline visualization
See opportunities by stage and keep track of the next step. The demo is on its way.
Ask about pipeline →010203
Pipeline, in view.
A new way to follow the work from first conversation to next step.
Coming soonStart with a real question
What do you need to know today?

Sales + Inventory + Operations → Clear decisions
A fuller view of the business
See your plan through your customers’ reality.
You know what you planned to ship and when. Spike Retail brings that together with what your customers are actually seeing at retail—so every decision starts with the full story.
Simple by design
From scattered data to shared direction.
- 01Connect the dotsWe learn your business and bring the right data together.
- 02Make it usefulWe shape information into clear signals and intuitive views.
- 03Move with confidenceYour team gets the visibility to act on what matters next.

Ready when you are
Let’s make your data work harder.
Tell us about your business and what you need to see.