
Explore Spike Retail
Take a look around.
Sales, shelf, forecasting, and pipeline—built for the work you do.
Explore Spike
Your business, from four angles.
Pick a view to see what’s inside. The demos use fictional data.
Interactive demo
Sales performance
See sales, velocity, inventory, and distribution in one view. Change the time period or drill into an item.
Open sales demo →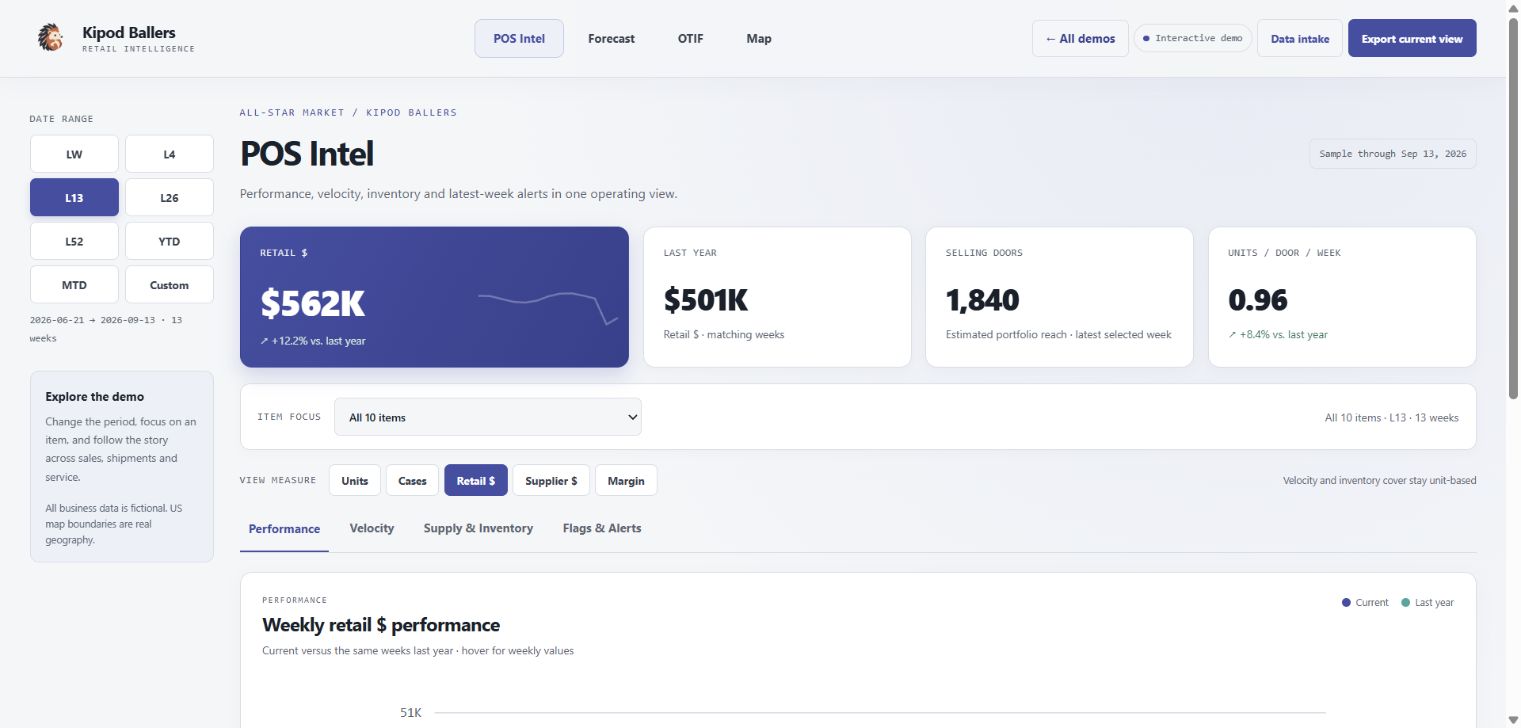
Actual demo screen · fictional data
Interactive demo
Shelf on a Page
See item performance alongside shelf space, category share, and the numbers behind each takeaway.
Open shelf demo →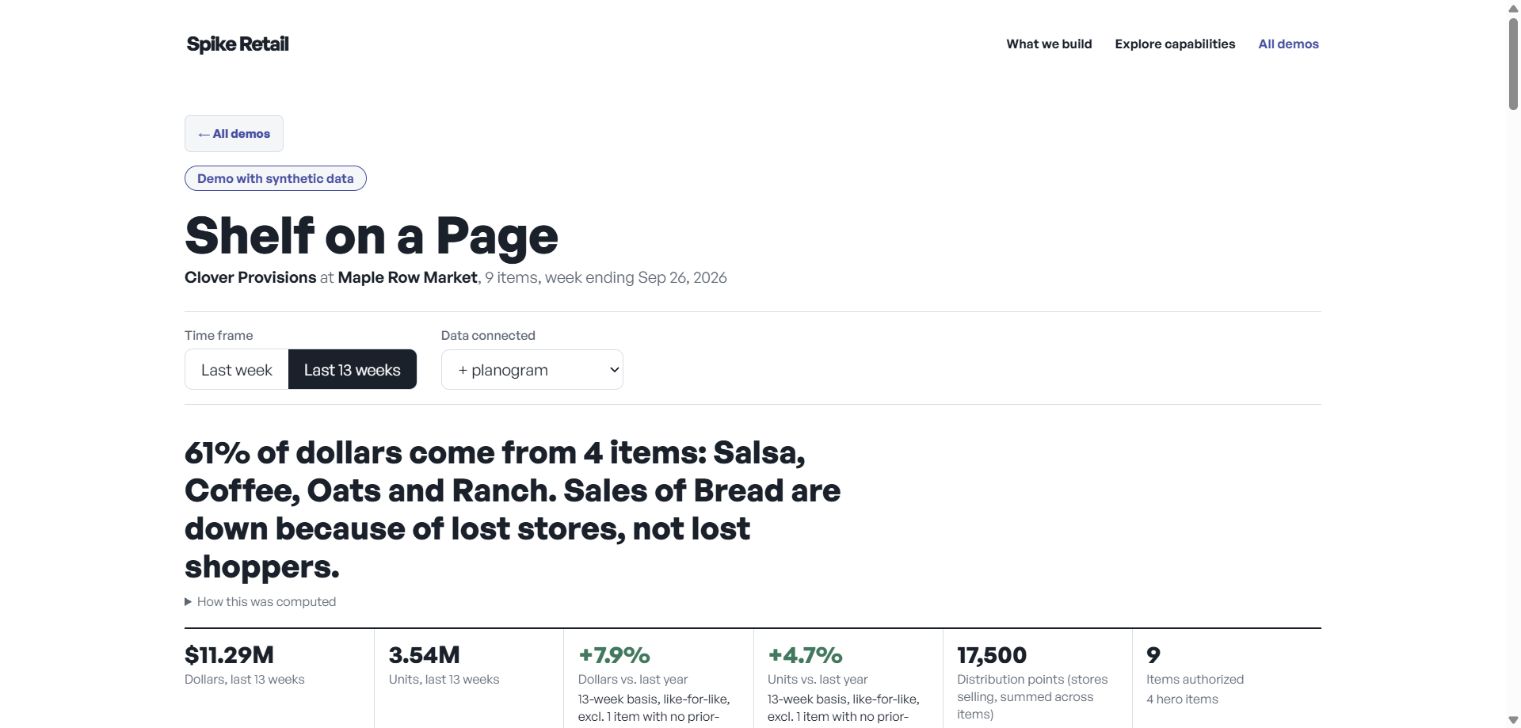
Actual demo screen · fictional data
Interactive demo
Forecasting
Compare planned shipments with the customer forecast, review consumption, and see shortfalls by date.
Open forecast demo →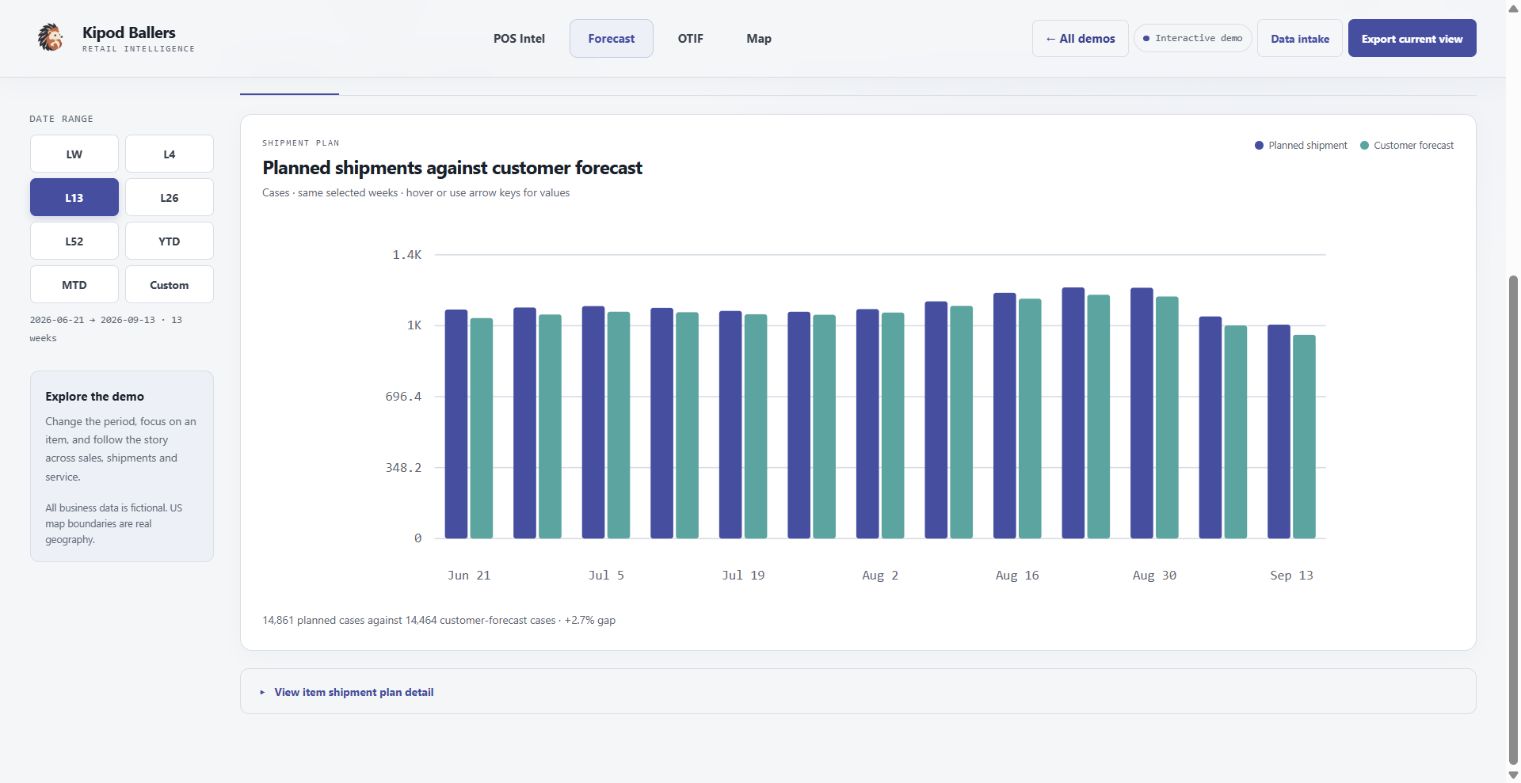
Actual demo screen · fictional data
Sample view
Pipeline visualization
See new business and opportunities at risk by stage, so you know where to focus.
Ask about pipeline →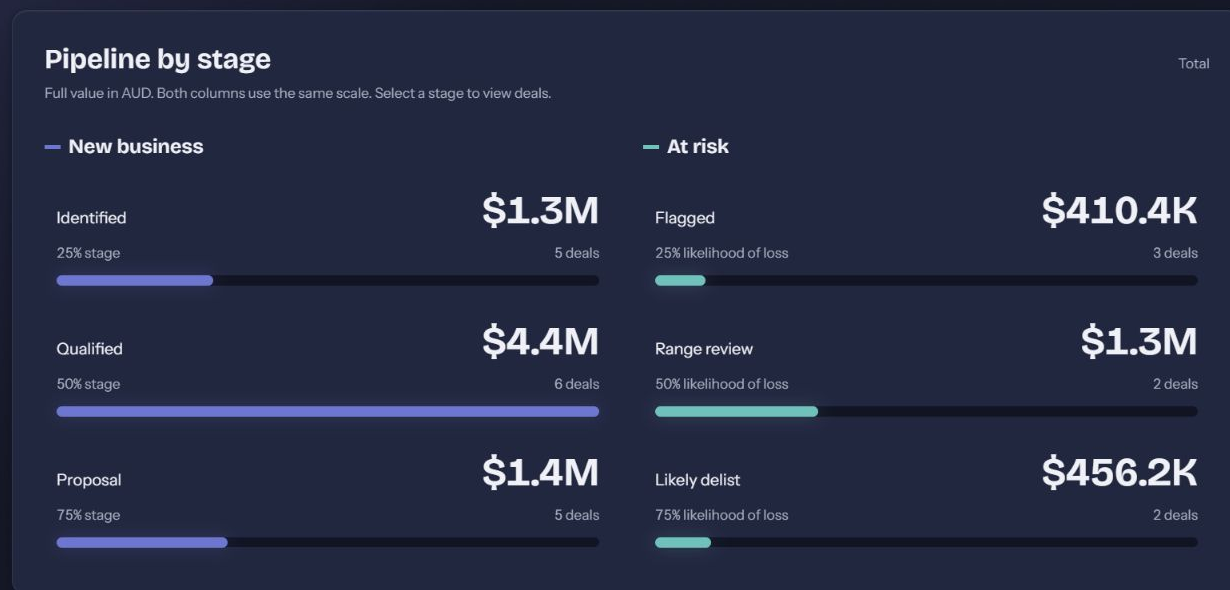
Sample screen · fictional data